Analytics Export
Mtracer allows you to export analytics for the traces and spans generated by executed tests.
Multiple export methods can be specified simultaneously by repeating the --analytics or -a flag with different values. Supported methods are:
json: exports the analytics data in JSON format.html: generates an interactive HTML report with detailed analytics.
This feature is particularly useful when running the same test multiple times using the --count flag. It provides a comprehensive overview of the system under test’s performance, highlighting any variations or anomalies in the results.
JSON Export
When using the json export method, Mtracer generates a JSON file containing the analytics of the traces and spans collected during the test execution. The JSON file can be easily parsed and integrated into monitoring tools or data analysis pipelines.
The JSON file contains the following fields:
| Field | Description |
|---|---|
testName | Name of the executed test suite |
timestamp | Timestamp of the test execution |
traces | Array containing the trace data collected during the test execution |
traceAnalytics | Object containing the global analytics of the traces collected during the test execution |
traceAnalytics.minDuration | Minimum duration among all collected traces (in milliseconds) |
traceAnalytics.maxDuration | Maximum duration among all collected traces (in milliseconds) |
traceAnalytics.p50Duration | 50th percentile (median) of the trace duration (in milliseconds) |
traceAnalytics.p90Duration | 90th percentile of the trace duration (in milliseconds) |
traceAnalytics.p99Duration | 99th percentile of the trace duration (in milliseconds) |
traceAnalytics.durationStandardDeviation | Standard deviation of the trace duration |
traceAnalytics.averageDuration | Average duration of the collected traces |
traceAnalytics.averageSpanCount | Average number of spans per trace |
traceAnalytics.averageSpanErrorCount | Average number of spans with errors per trace |
traceAnalytics.errorRate | Percentage of traces that contain at least one span with an error status |
traceAnalytics.spanAnalytics | Array containing detailed analytics grouped by span from different traces with the same serviceName and operationName |
traceAnalytics.spanAnalytics.[].serviceName | Name of the service to which the span belongs |
traceAnalytics.spanAnalytics.[].operationName | Name of the operation executed by the span |
traceAnalytics.spanAnalytics.[].minDuration | Minimum recorded duration for this operation (in milliseconds) |
traceAnalytics.spanAnalytics.[].maxDuration | Maximum recorded duration for this operation (in milliseconds) |
traceAnalytics.spanAnalytics.[].p50Duration | 50th percentile (median) duration of this operation (in milliseconds) |
traceAnalytics.spanAnalytics.[].p90Duration | 90th percentile duration of this operation (in milliseconds) |
traceAnalytics.spanAnalytics.[].p99Duration | 99th percentile duration of this operation (in milliseconds) |
traceAnalytics.spanAnalytics.[].durationStandardDeviation | Standard deviation of the duration for this operation |
traceAnalytics.spanAnalytics.[].averageDuration | Average duration of this operation |
traceAnalytics.spanAnalytics.[].errorRate | Error rate specific to this operation (as a percentage) |
traceAnalytics.spanAnalytics.[].averagePercentageOfTotalTrace | Average percentage of the time spent by this span relative to the total duration of the parent trace |
averagePercentageOfTotalTrace metric, since the sum of all span percentages will most likely not equal 100%.HTML Export
When using the html export method, Mtracer generates an interactive HTML report that allows you to intuitively visualize the trace and span analytics. The HTML report includes charts and tables that make it easier to analyze the performance of the system under test, enabling quick identification of bottlenecks or anomalies in the results.
Below are some example screenshots of the HTML report generated by Mtracer:
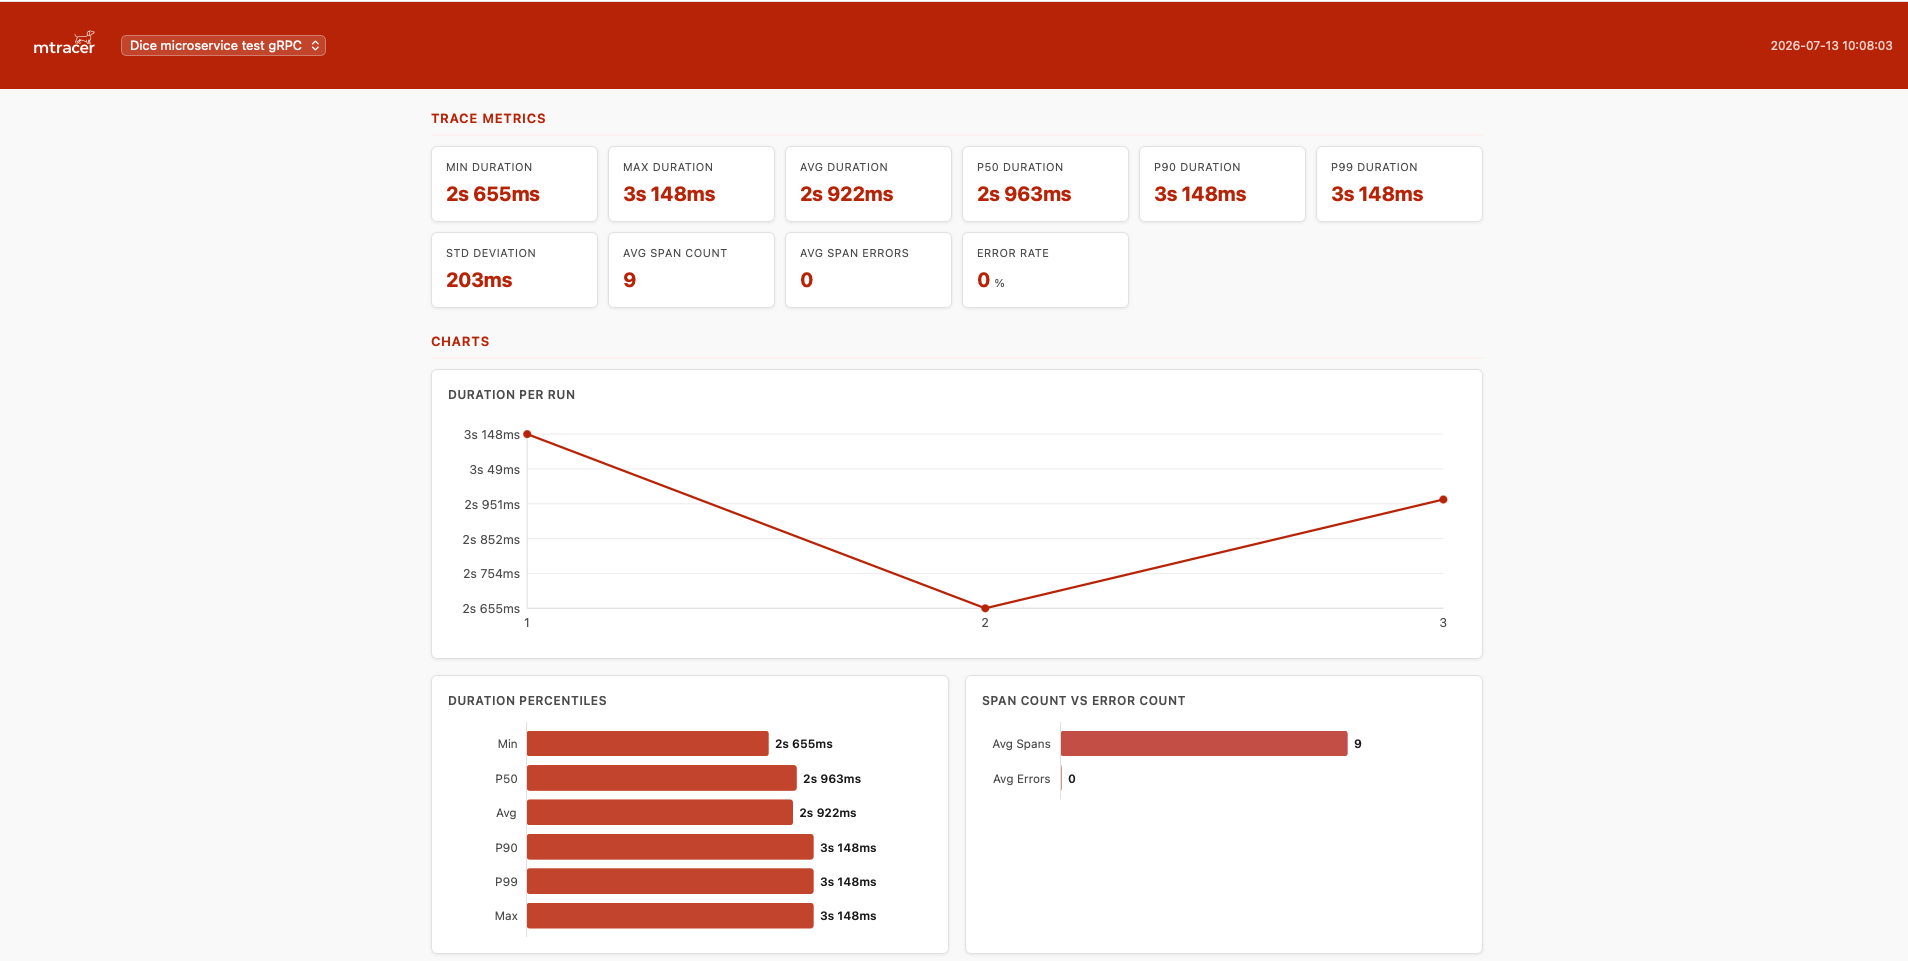
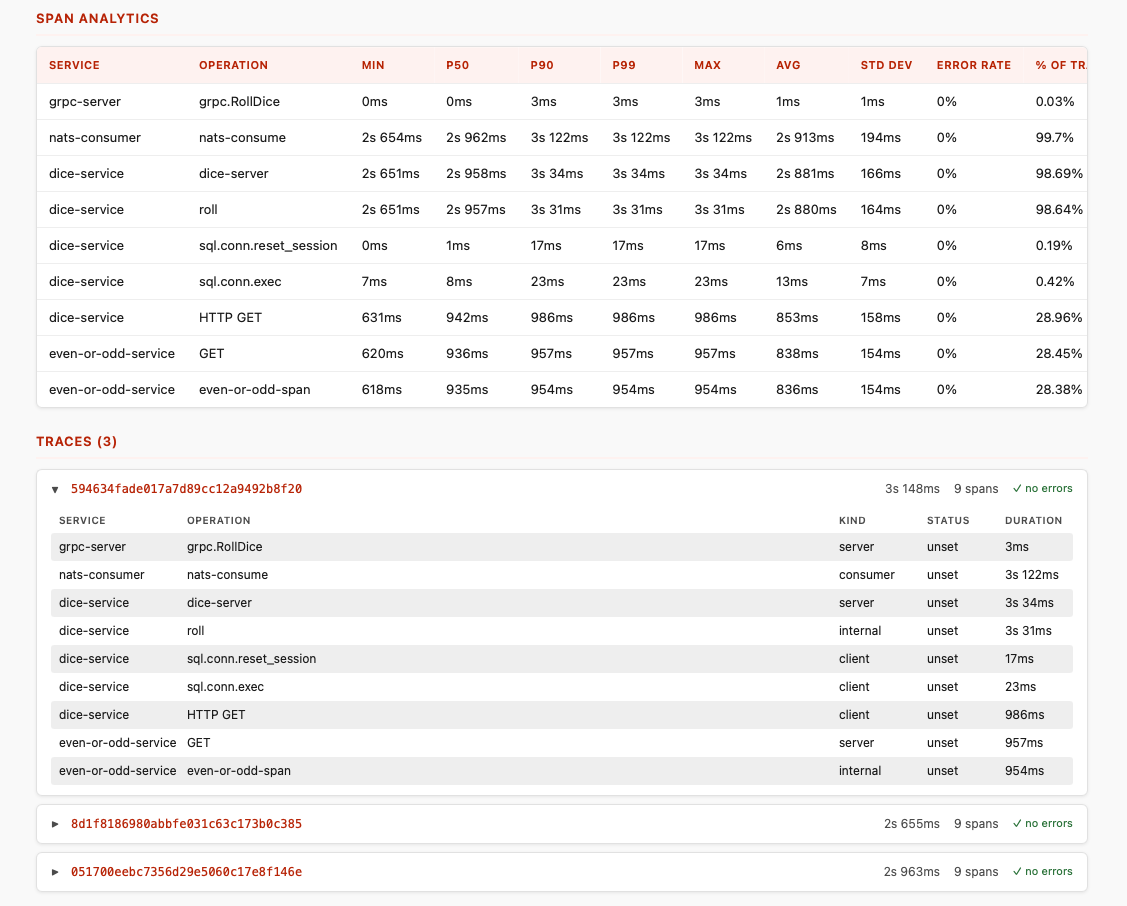
The HTML report shows:
- the main analytics of the traces and spans collected during the test execution;
- a chart of the trace durations grouped by run number;
- two histograms comparing different duration metrics, as well as the average number of spans compared to the average number of spans with errors;
- a detailed table of span analytics grouped by serviceName and operationName;
- the actual traces and spans collected for each test run, grouped by traceId. These display every span contained in the selected trace.
Additionally, from the drop-down menu in the top-left corner, you can select a specific test to view its analytics.